
Monitor key metrics such as (CPU, memory, disk).
Application monitoring and observability are critical for ensuring the performance, reliability, and user experience of applications. Here’s how Bigtecsys supports application monitoring and observability
- Monitor key metrics such as response times, error rates,(CPU, memory, disk).
- gain real-time visibility into application performance cloud,and hybrid environments.
Managing your modern applications made easy (APM)
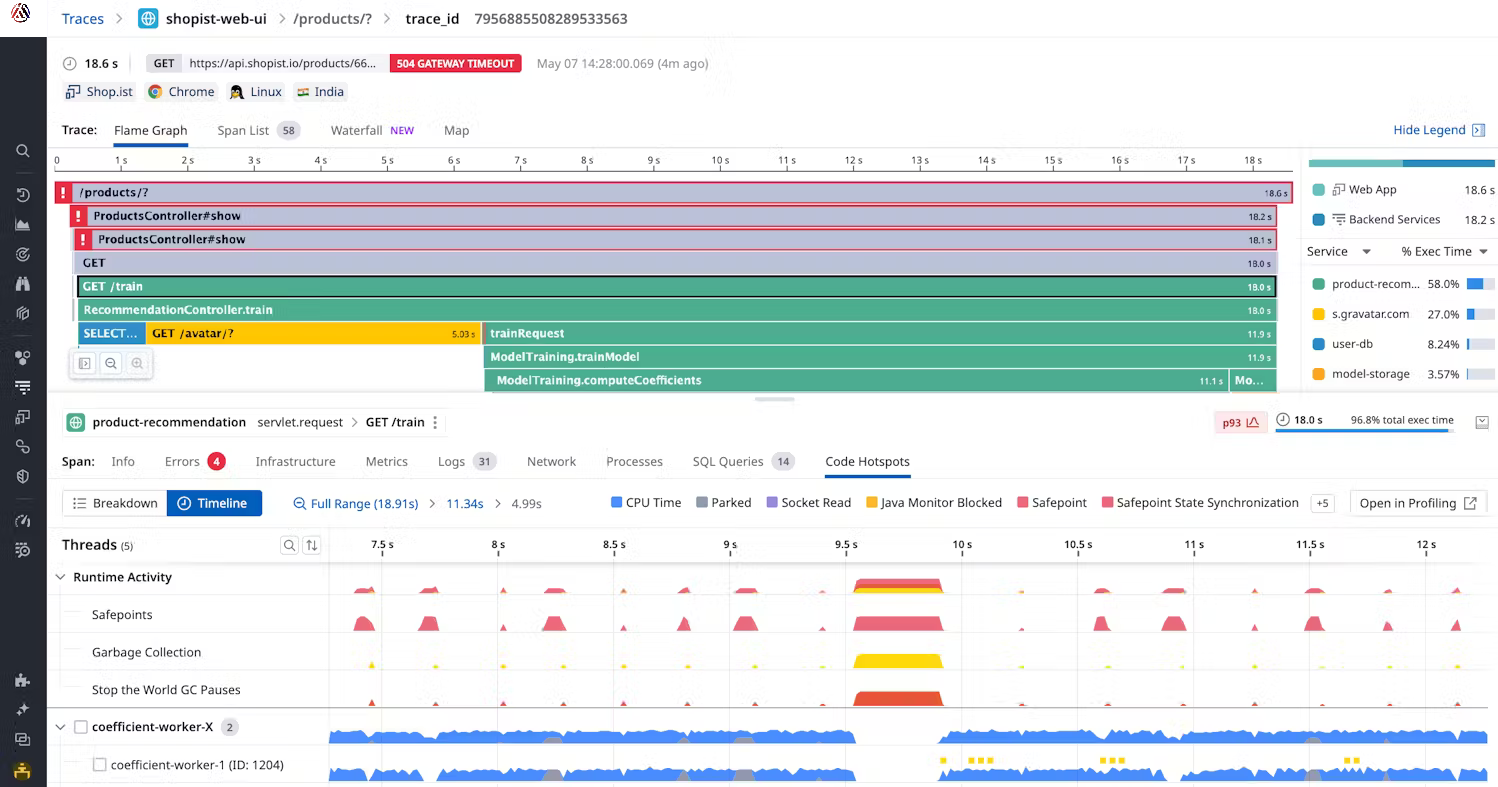
Comprehensive code level monitoring
For comprehensive code-level monitoring and observability, Bigtecsys offers advanced features designed to provide deep insights into application performance and troubleshoot issues effectively
Distributed tracing: trace Waterfall: Automatically map and visualize the entire path of a request or transaction across distributed services.
Live Code Profiling: real-time Performance Analysis: Monitor application performance metrics at the code level.
Exception tracking: Contextual Exception reporting: Capture and summarize exceptions occurring within the context of a service or transaction.
End-to-End Visibility: transaction Monitoring: track the entire lifecycle of transactions, from user interactions through backend services and databases.
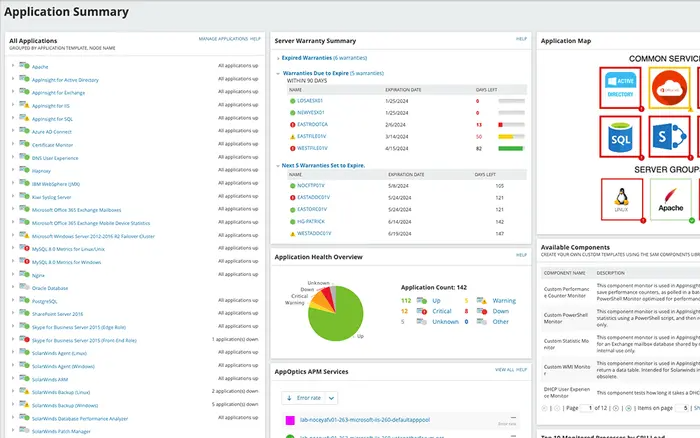
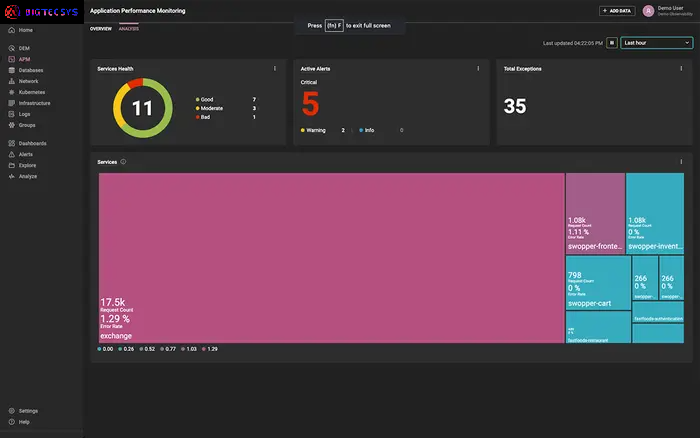
Accelerating Commercial Application Issue resolution
Accelerate commercial application issue resolution and achieve end-to-end visibility across hybrid infrastructure, Bigtecsys provides robust capabilities designed to streamline troubleshooting and enhance performance monitoring
Consolidated Dashboard: real-time Monitoring: Monitor metrics such as response times, error rates, throughput, and resource utilization in real-time.
root Cause Analysis: Advanced troubleshooting tools: Utilize tools for root cause analysis to quickly pinpoint the source of application issues.
Hybrid Infrastructure support: Monitoring Across Environments: Monitor applications deployed on-premises, in the cloud, or in hybrid environments.
real-time application metrics for custom applications and services
real-time application metrics and visualization across a broad range of programming languages and services, Bigtecsys offers robust capabilities tailored to monitor custom applications effectively. Here’s how Bigtecsys supports real-time application metrics and visualization
Broad Application support: Programming Languages: Monitor applications written in Java, Python, PHP, .NEt, Node.js, ruby, go Lang, and more.
real-time Metrics: Performance Metrics: Monitor key performance indicators such as response times, throughput, error rates, and resource utilization in real-time.
service Dependencies and relationships: Dependency Mapping: Visualize relationships and dependencies across services and microservices.
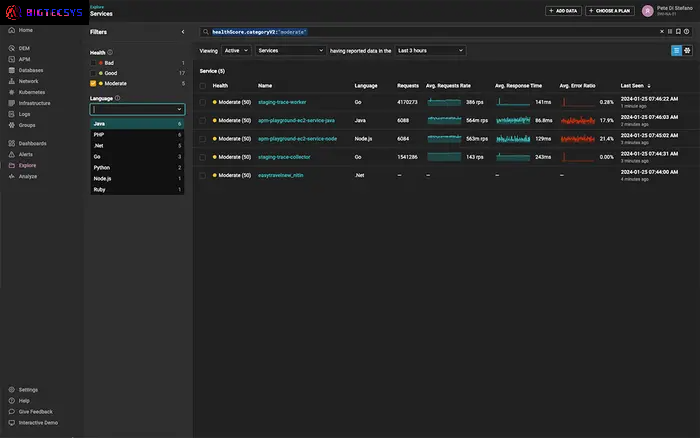
service health and detailed drilldowns
to proactively monitor and observe modern distributed applications, including rapid identification of performance issues and accurate troubleshooting, Bigtecsys offers advanced capabilities leveraging machine learning-driven health scores and detailed drilldowns
Machine Learning-Driven Health scores: Predictive Health Monitoring: Utilize machine learning algorithms to assess the health of services and microservices based on historical data and patterns.
real-time Monitoring and Observability: service Health Dashboard: View real-time health scores and status indicators for services and microservices across the distributed application environment.
Fast and Accurate troubleshooting: Drilldown Capabilities: Drill down into detailed performance metrics, logs, and diagnostic data to troubleshoot issues rapidly.
Application Monitoring and Observability
successful cloud migration can transform your organization by offering numerous benefits. Bigtecsys provides tools to benchmark and optimize the performance of on-premises workloads before and after migration, ensuring a smooth and efficient transition
Hybrid Cloud Observability
self-hosted observability to take you from reactive to proactive across on-prem and hybrid It environments.
- Deployment to meet your needs, whether behind your firewall or self-hosted in AWs®, Microsoft® Azure, or gCP®
- Flexible licensing – allocate nodes across multiple instances – and optimal scalability
- Built from our years of network management leadership and enhanced with machine learning
Bigtecsys Observability
saas-delivered observability to simplify management of cloud-native and hybrid It environments.
- Visibility across your hybrid It landscape, including custom apps, microservices, Kubernetes, and containers
- Accelerate insights with unified data across metrics, traces, logs, and user experience
- Extensible with open-source framework, public API, and out-of-the-box third-party integrations
Database Performance Analyzer
Cross-platform database monitoring and management software built for sQL query performance monitoring, analysis, and tuning
- Agentless and designed to be easy to install with quick time-to-value and low overhead of 1% or fewer
- runs on either Windows® or Linux® servers, in Azure, or as an AWs subscription
- goes beyond problem analysis by providing expert advice with table tuning and query advisors
Let's try! get Free support
start your 6-Day Free trial
From security to observability and beyond, Bigtecsys helps you go from visibility to action.